2003 National League

All data in these graphs as of September 13
You can also view these related graphs:
National League East
NL as of May 4th
NL as of August 2nd
National League Central
NL as of May 25th
NL as of August 23rd
National League West
NL as of July 1st

Runs Scored and Allowed

Comments How to Read this Graph
August 24, 2003
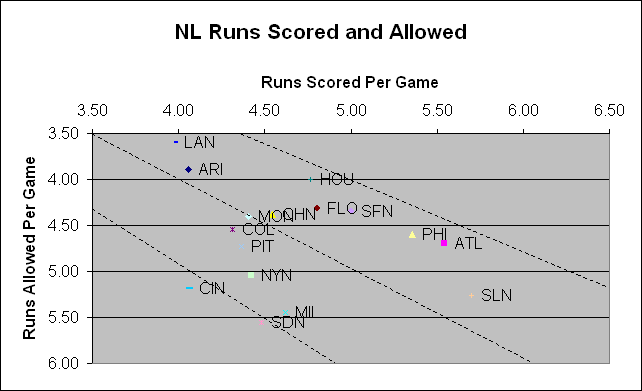
One of the things that's fun to do is link to graphs from earlier in the year (above links). That way, you can follow the trend of a team over the full season. And if you have a cable connection, it's almost like watching a slowly flickering movie.

Try watching the Marlins' progression during the year, for instance, as they've climbed from bottom left to upper right. The Expos have improved their pitching in the last month, and the Mets have made a surge in August. The Cardinals remain the best (park-adjusted) offensive team, the Dodgers remain the top defensive team (regardless of park) and there is no .600 team in this league, based on underlying run dynamics. Houston would have a clear lead in the Central if their run distribution were true.

Team Wins +/-
ARI -1.91
ATL 5.40
CHN 2.41
CIN 5.31
COL -4.11
FLO 1.40
HOU -6.08
LAN -0.33
MIL 2.48
MON 0.39
NYN -0.47
PHI -3.72
PIT -0.66
SDN 1.39
SFN 6.98
SLN -3.62


OBP and SLG by Team

Comments How to Read this Graph
August 24, 2003
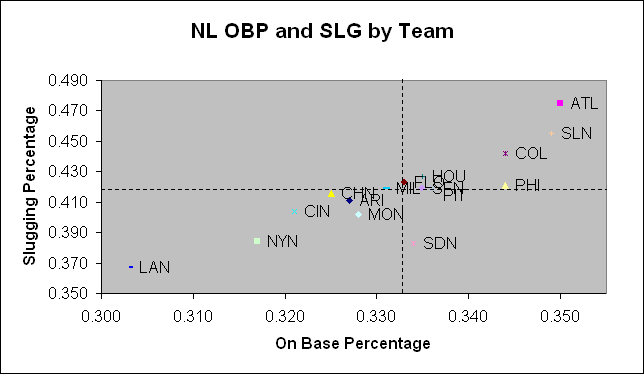
Over the last month, the Mets' offense has moved into the middle of the pack, leaving the Dodgers alone as the worst offense in the league. Remember, however, that this graph does not correct for ballpark factors, so the Dodgers' true offensive talent is not quite this bad.

Among other teams, the Phillies' slugging has been slowly improving during the year, but still not what was expected. The Padres could really use a slug of slugging. And the Padres and Brewers should be scoring a lot more runs than they are. Part of the problem is that they're both batting poorly with runners in scoring position (Padres=.237 BA and Brewers=.244).

Team Runs +/-
ARI -0.11
ATL -0.10
CHN -0.11
CIN -0.03
COL 0.08
FLO -0.04
HOU 0.12
LAN -0.06
MIL -0.32
MON 0.06
NYN 0.13
PHI -0.09
PIT -0.11
SDN -0.28
SFN -0.10
SLN 0.00


Pitching and Defense

Comments How to Read this Graph
August 24, 2003
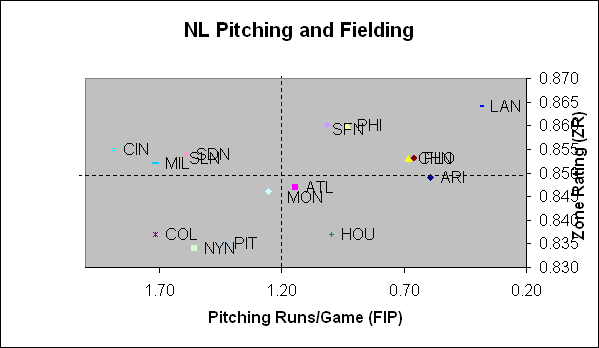
The switch from DER to Zone Rating has significantly changed a couple of teams' standings. It's really helped the Reds, Dodgers, Padres and Marlins, and hurt the Astros and Rockies. I don't know how much park effects impact Zone Rating. It could be a factor in the Dodgers' and Reds' high standings.

Least appreciated pitching: Houston's. Least appreciated fielding: Reds.

Graph Change

Thanks to a suggestion from a faithful reader, I have changed the parameter for the defense portion of this graph from Defense Efficiency Ratio to Zone Rating. Zone Rating, which is computed by Stats and is available on the ESPN website, is the number of batted balls successfully turned into outs divided by the number of balls that are hit into "fieldable" zones. As such, it is a cleaner measure of fielding than DER.