National League East Team-by-Team
Review the National League Graphs
Here's a view of the NL East standings on a day-by-day basis, starting with the tenth game of the season.
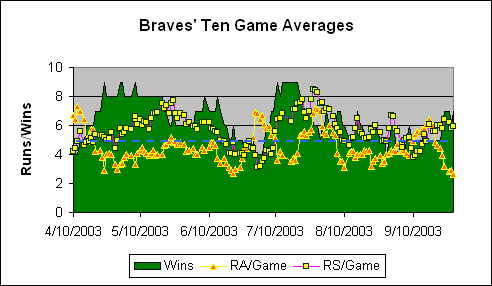
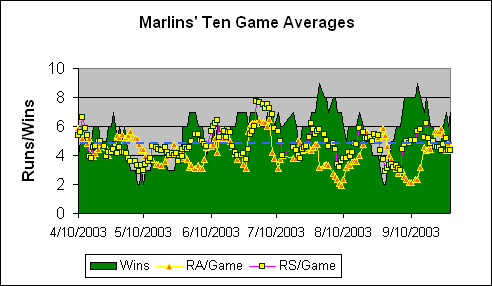
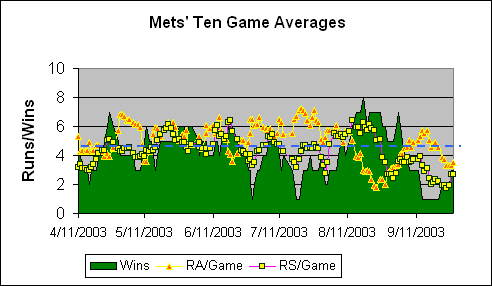
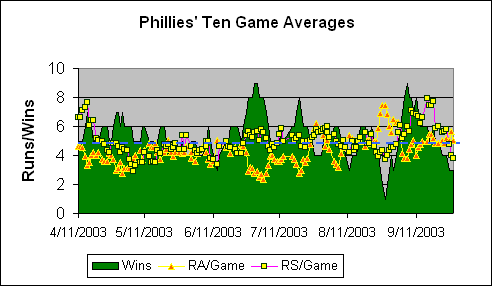
Following are graphs of the ten-game averages for each team. The green area represents the number of games each team has won of its last ten played. The two lines are 10-game moving averages of runs scored and allowed per game over the same time period, adjusted for park factors. The fixed line represents the league average number of runs scored per game.
The tables list vital stats by month. FIP stands for "Fielding Independent Pitching" and is based on the following formula: (13*HR+3*BB-2*K)/IP. DER stands for "Defense Efficiency Ratio" and is essentially calculated this way: Non-catcher putouts/# of balls hit fairly (not including HRs). The DER stats on this page are based on limited data; the trend between months per team is more valid than the absolute number.

|
Atlanta Braves Comments
August 21, 2003 The Braves are now outperforming their projected win/loss record by six games (it was more like nine games in early July). The Braves are actually 13-18 in one-run games, but their pitching staff has had games in which they've given up 20, 17, 16 and 15 runs. Runs above eight to ten in a game don't really hurt. The Braves' offense exploded in July. Although the offense has returned to the blue line in August, the pitching and fielding have picked up the slack. In fact, there has only been one extended period in which the Braves' average runs allowed were lower than runs scored. That occurred in late June and early July, and included the 20-1 loss to the Marlins. The Braves' cadre of everyday players is incredibly strong. They are first at C and 2b, third at SS, fourth at 3B and two of the top five OF are Braves (and three of the top ten). View Individual Player Win SharesView individual player stats |

|
Florida Marlins Comments
August 21, 2003 The Marlins have actually won more games than the Braves since June 1st. They particularly had a great run at the end of July and early August, against some pretty good teams (Arizona, Philly, Atlanta and Montreal). As you can see on the chart, it's been a bit of a roller coaster ride for the Marlins during this period. At times, their offense has taken the lead, but at other times it's been the pitching. As pointed out on the NL charts, their below-average fielding somewhat obscures the strength of their pitching, which is second only to Los Angeles. Their real fielding weakness lies in the outfield. All of the infielders are at or near the top of the fielding Win Shares list, but Juan Pierre is their top-rated outfielder, and he's fifteenth. View Individual Player Win SharesView individual player stats |

|
Montreal Expos Comments
August 31, 2003 As noted elsewhere, the Expos were a completely different team this year with and without Vladimir Guerrero. But it's also worth noting that the Expos received phenomenal pitching in August, putting them back in the wildcard race. Vazquez and Hernandez have been outstanding, among the top six pitchers in the league, according to Win Shares. But even guys with names like Ohka, Day and Tucker have been pitching well. Unfortunately, their bullpen is one of the worst in the league. View Individual Player Win SharesView individual player stats |

|
New York Mets Comments
August 21, 2003 Well, look at the Mets. Management finally did the right thing, unloaded washed-up veterans and let some kids play. Mets' fans actually now have something to look forward to. But the real key behind this recent run (the most successful of the season) has been the return of their pitching. Leiter, Glavine and Trachsel have all pitched well, and even Seo and Heilman have had their moments. Now that Cliff Floyd is out for the season, the race for Win Shares team leader is wide open. Don't be surprised if it's Jason Phillips by the end of the year. View Individual Player Win SharesView individual player stats |

|
Philadelphia Phillies Comments
August 31, 2003 The Phillies certainly picked a bad time to go into a slump. They lost nine of ten games at the end of August, primarily due to a blowup by the pitchers (though the offense didn't help, either). The "pythagorean advantage" (larger run differential) they used to hold over the Braves is now completely gone. The Phillies and the Dodgers are the two best fielding teams in the league. Although no particular fielder is a standout (other than maybe David Bell), they are all near the top of the position lists in fielding Win Shares, and their Zone Rating is the best in the league. View Individual Player Win SharesView individual player stats |
