| Comments | How to Read this Graph |
| August 2, 2003
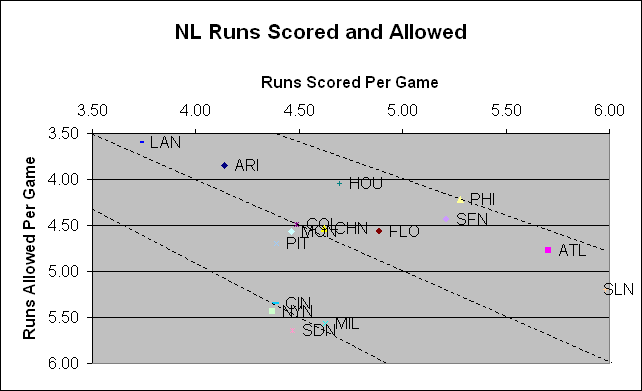
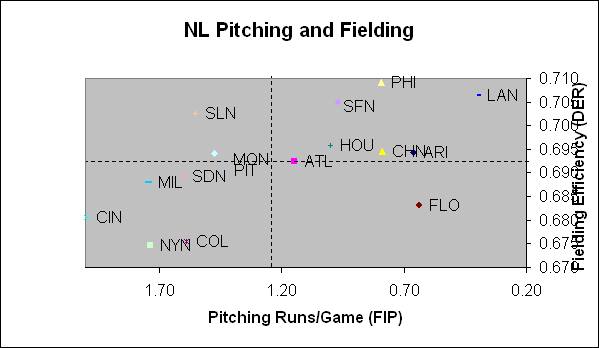
No team above the .600 isotope. According to Run Differential, the Phillies are the best team in the league. Unfortunately, Pythagoras has given the Braves an twelve-game lead over them. I keep waiting for things to break the Phillies' way. Down in the lower left, there are four teams vying for the title of league worst. Of those four, it is the Mets who have virtually nothing going for them (as you'll see on the following graphs). The Dodgers used to be all by themselves on this graph, but the Diamondbacks are giving them a run for the title of "Upper Left Champ". In fact, you might call the Diamonbacks Dodger-wannabes. Their run differential is virtually even. | |
| Team | Wins +/- |
| ARI | -2.54 |
| ATL | 8.65 |
| CHN | 0.08 |
| CIN | 4.88 |
| COL | -0.76 |
| FLO | 1.11 |
| HOU | -2.92 |
| LAN | -1.36 |
| MIL | -0.90 |
| MON | 2.10 |
| NYN | 0.73 |
| PHI | -3.44 |
| PIT | -0.73 |
| SDN | -0.91 |
| SFN | 6.07 |
| SLN | -3.98 |

