Major League Baseball Graphs The Dirty Details

2003 National League

Also view these related graphs:
National League East
NL as of May 4th
National League Central
National League West

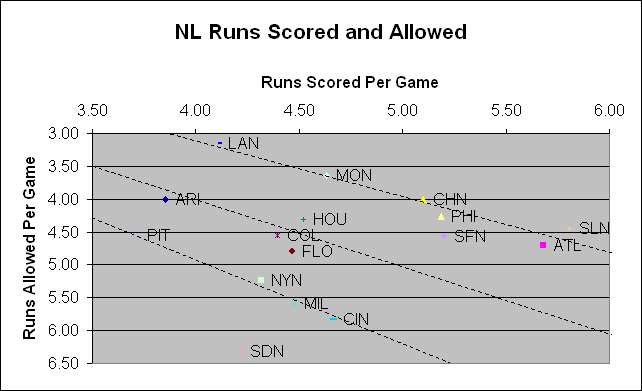
Runs Scored and Allowed

Comments How to Read this Graph
May 25, 2003
Whole bunch of teams hovering around the .600 isobar. St. Louis and Atlanta represent the hitting extremes, while the Dodgers are the leaders, by far, in least runs allowed. Remember, these figures are normalized by historic ballpark factors, so the Dodgers really are that good. St. Louis should have more wins than anyone, but they are an incredible 2-13 in one-run games. That should change. Look for Cincinnati to recede to the .400 level, too. The NL East looks like a real battle between three evenly matched teams, doesn't it?
TeamWins +/-
ARI-1.35
ATL4.71
CHN -1.88
CIN3.82
COL -1.57
FLO -1.87
HOU-0.10
LAN-0.72
MIL-1.78
MON1.59
NYN1.62
PHI -2.21
PIT-0.23
SDN-1.92
SFN2.85
SLN-4.50


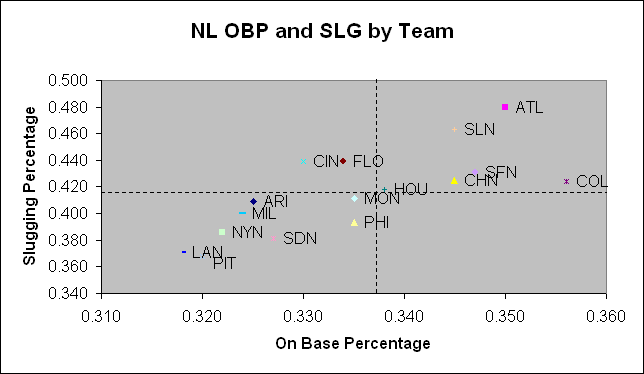
OBP and SLG by Team

Comments How to Read this Graph
May 25, 2003
This graph establishes Atlanta as the best offensive team in the league. St. Louis has been helped by the distribution of some of its runs elements. Incredibly, Colorado's slugging percentage is only league average, though its OBP leads the league. Philadephia is another team that its scoring more runs than its base run elements would indicate. Thome and friends have disappointed in the slugging department. Look for their offense to decline. One other team to note is Cincinnati, with one of the best slugging averages in the league, but less-than-average runners on base.
TeamRuns +/-
ARI-0.67
ATL-0.03
CHN 0.14
CIN-0.23
COL -0.81
FLO -0.60
HOU-0.30
LAN0.23
MIL-0.06
MON0.14
NYN0.20
PHI 0.73
PIT-0.35
SDN-0.12
SFN0.11
SLN0.49


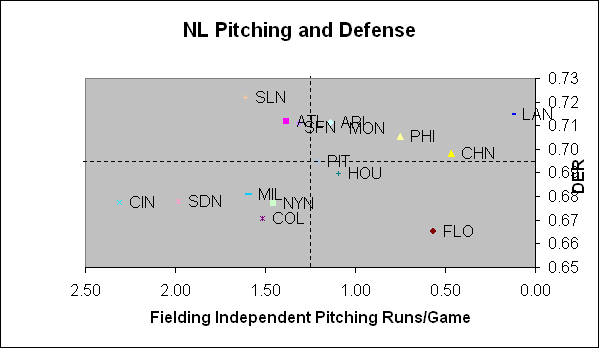
Pitching and Defense

Comments How to Read this Graph
May 25, 2003
A graph of extremes. St. Louis is the best fielding team, by far, but has below average pitching. Dodgers are great on the mound and in the field, even correcting for that home park of theirs. Florida, meanwhile, has the third-best pitching staff in the league, but they're being let down by the guys in the field. Lastly, Cincinnati just stinks.
TeamDER +/-
ARI0.006
ATL-0.001
CHN -0.003
CIN0.001
COL0.025
FLO -0.001
HOU0.005
LAN-0.010
MIL-0.005
MON0.002
NYN-0.006
PHI -0.003
PIT-0.003
SDN-0.005
SFN-0.006
SLN-0.004

Major League Baseball Graphs The Dirty Details