National League West Team-by-Team
Review the National League Graphs
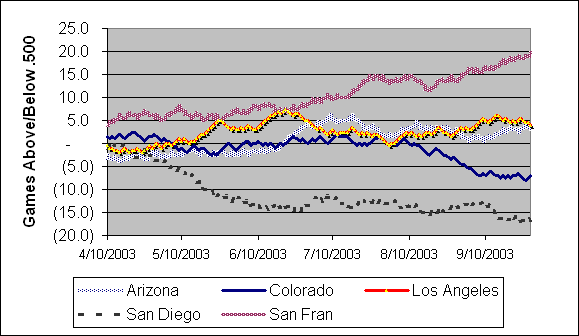
Here's a view of the NL West standings on a day-by-day basis, starting with the tenth game of the season.
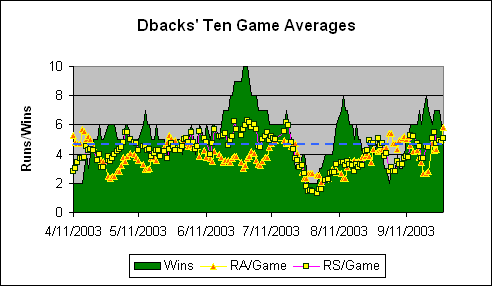
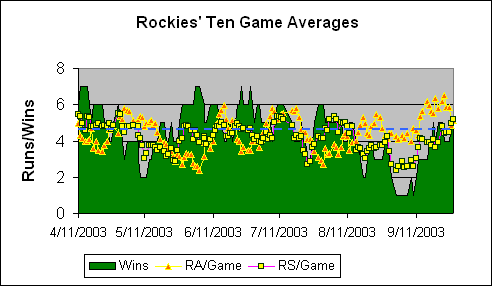
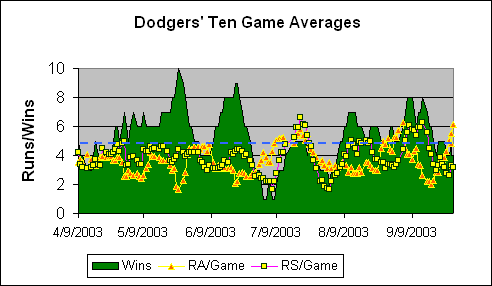
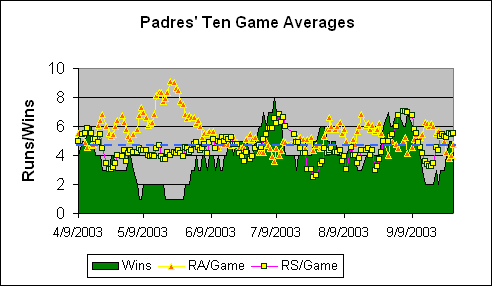
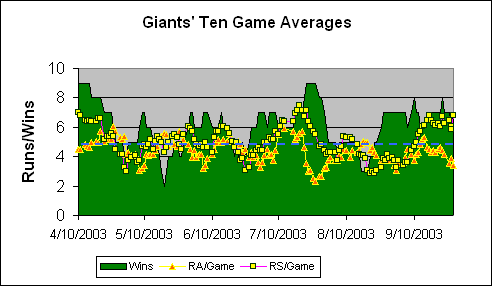
Following are graphs of the ten-game averages for each team. The green area represents the number of games each team has won of its last ten played. The two lines are 10-game moving averages of runs scored and allowed per game over the same time period, adjusted for park factors. The fixed line represents the league average number of runs scored per game.
The tables list vital stats by month. FIP stands for "Fielding Independent Pitching" and is based on the following formula: (13*HR+3*BB-2*K)/IP. DER stands for "Defense Efficiency Ratio" and is essentially calculated this way: Non-catcher putouts/# of balls hit fairly (not including HRs). The DER stats on this page are based on limited data; the trend between months per team is more valid than the absolute number.
|
Arizona Diamondbacks Comments
August 31, 2003 The months of June and August were tremendous months for Diamondbacks' pitching. Brandon Webb has had an outstanding rookie season, and Curt Schilling has come back from injury very well. June was also a great month for the DBack's offense, led by the Kiddie Corp of players named Cintron and Kata. Unfortunately, the offense struggled big-time in July and August. Only one player, the redoubtable Luis Gonzalez, has more than ten batting Win Shares. Los Angeles is the only other NL team that can make the same claim (with Shawn Green playing the Gonzalez role). After a fast start, Shea Hillenbrand has not been the hitter he was for the Red Sox. Win Shares since that trade: Hillenbrand/AZ: 4, Kim/BOS: 7. View Individual Player Win SharesView individual player stats |
|
Colorado Rockies Comments
August 31, 2003 The Rockies were hanging in there with a .500 record until August, when they went up against the pitching of the Dodgers, Giants, Braves, Expos and rejuvenated Mets. The offense took a dive, and the pitching and fielding couldn't hold up the team. That home field really messes them up. The offense is averaging 3.9 runs/game on the road and 6.5 runs/game at home. But the pitching ERA is 5.33 on the road and 4.86 at home. Go figure. Among individual players, Todd Helton is now pretty clearly the best first baseman in the league, according to Win Shares. And I'll admit that I had never really noticed Brian Fuentes before. But, the 28 year old lefty actually has the most pitching Win Shares on the Rockies' staff. View Individual Player Win SharesView individual player stats |
|
Los Angeles Dodgers Comments
August 31, 2003 The Dodgers have had consistently great pitching and fielding all season long, even when correcting for the home park. In fact, they stand out for the consistency of their performance. At only one point during the year (early July) did their Runs Allowed average trend significantly above the blue line. And that stretch included a visit to Coors. August was their best offensive month of the year, but that's only a relative plus. The offense still stunk. The Dodgers made some midseason deals to improve the offense, but only the acquisition of Burnitz paid dividends. Another sign of the bizarre: only LoDuca and Green have more batting win shares than Izturis' fielding Win Shares. View Individual Player Win SharesView individual player stats |
|
San Diego Padres Comments
August 31, 2003 There are some interesting things going on in San Diego, what with the trade for Brian Giles. The Padres are obviously positioning themselves for next year, and they have a number of pieces in place. Unfortunately, this team is not yet building momentum on the field, though they gave it a shot in early July. They particularly need to reduce their runs allowed if they're going to achieve some success. San Diego is the only team in the National League to have no pitchers with more than six Win Shares, though Brian Lawrence has been pitching well lately. With all the comings and goings, Mark Loretta has been amazingly steady. He leads the team in Win Shares, and he's even giving Marcus Giles a run for the title of best second baseman in the league. View Individual Player Win SharesView individual player stats |
|
San Francisco Giants Comments
August 31, 2003 After I said that the Giants were running out of luck in mid-August, they turned around and won five out of six one-run games in late August. The story, of course, was Barry Bonds, who seems to be the primary reason they are now 23-9 in one-run games. The MVP race between Bonds and Pujols is too close to call. Rich Aurilia and Jeff Hammonds have also been contributing with the bats lately. Jason Schmidt has solidified his credentials as Cy Young contender. And Sidney Ponson has been a nice pickup for the Giants; he already has as many Win Shares as Damian Moss had in his time with the Giants. View Individual Player Win SharesView individual player stats |
