Major League Baseball Graphs The Dirty Details

2003 National League

Also view these related graphs:
National League East
NL as of May 4th
National League Central
NL as of May 25th
National League West

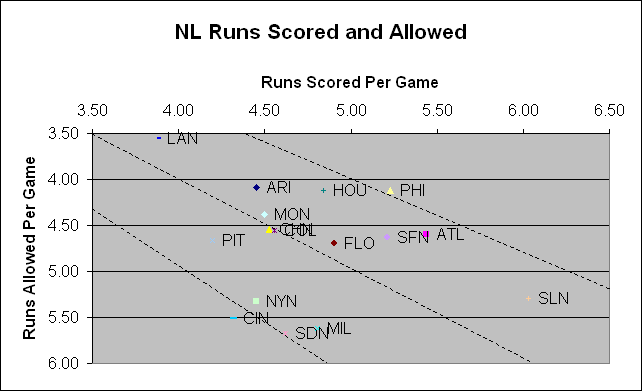
Runs Scored and Allowed

Comments How to Read this Graph
July 1, 2003
This is why I love graphs. Don't the Dodgers and Cardinals look like some ostracized kids at a party? I mean, do they have cooties or something? Truth is, the Dodgers' pitching and fielding are so good, and their offense so bad, that they deserve their own special place on the graph. The Cardinals' offense is staggeringly good at the other extreme, though their defense leaves something to be desired.

Truth is, there is not a .600 ballclub in the bunch. The Phillies look as though they may be about to break out onto the top, though Mr. Pythagoras is still smiling upon the Braves. Don't be surprised to see things go the Phillies' way soon.

TeamWins +/-
ARI0.92
ATL7.43
CHN -0.21
CIN6.28
COL -0.75
FLO-0.37
HOU-3.84
LAN-0.73
MIL-2.45
MON0.88
NYN1.56
PHI -3.43
PIT-0.50
SDN-3.58
SFN5.33
SLN-3.12


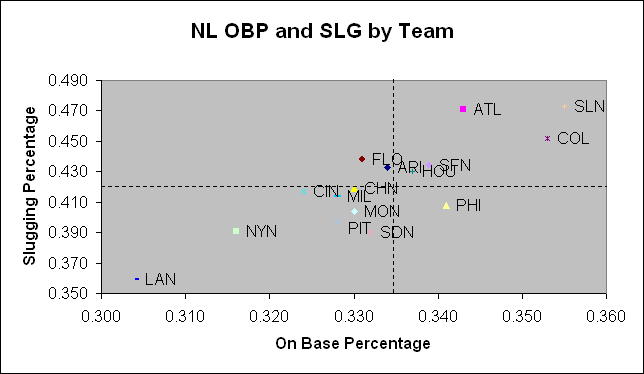
OBP and SLG by Team

Comments How to Read this Graph
July 1, 2003
Atlanta's offense, particularly its OBP, has cooled in the last month, while the Cardinals have continued their red-hot hitting. The Giants and Cubs have fallen back to earth, approaching average levels for both key offensive elements. And the Dodgers and Mets have separated themselves from the pack for worst-hitting teams. You can spot these trends at the team-specific graphs, linked at the top of this page. Colorado's offense hasn't been as good as this chart makes them look; see the run elements factor in the table. The Rockies' whole is not equalling the sum of the parts.
TeamRuns +/-
ARI-0.05
ATL-0.08
CHN-0.25
CIN0.05
COL0.10
FLO-0.17
HOU0.14
LAN-0.06
MIL-0.15
MON0.10
NYN0.08
PHI -0.04
PIT0.00
SDN-0.20
SFN-0.23
SLN-0.01


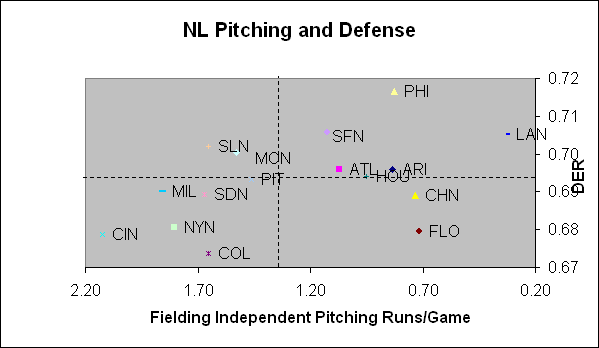
Pitching and Defense

Comments How to Read this Graph
July 1, 2003
Los Angeles: great pitching and great fielding. Their park has been called a great pitcher's park, but it's also a great fielder's park. Nevertheless, the Dodgers may have a couple of Gold Glovers in the middle of the infield. Colorado looks as though it has the worst DER in the league, but that's also due to their ballpark. Really, the Marlins have the worst fielding. The Phillies' surge in the last month has been largely due to its tremendous fielding (aka DER). Last month, their DER was in the middle of the pack.

Least appreciated pitching: Florida's. Least appreciated fielding: St. Louis.

TeamDER +/-
ARI0.006
ATL-0.001
CHN -0.003
CIN0.001
COL0.025
FLO -0.001
HOU0.005
LAN-0.010
MIL-0.005
MON0.002
NYN-0.006
PHI -0.003
PIT-0.003
SDN-0.005
SFN-0.006
SLN-0.004

Major League Baseball Graphs The Dirty Details