Major League Baseball Graphs The Dirty Details

2003 American League

Also view these related graphs:
American League East
AL as of May 4th
American League Central
AL as of May 25th
American League West
AL as of July 1st

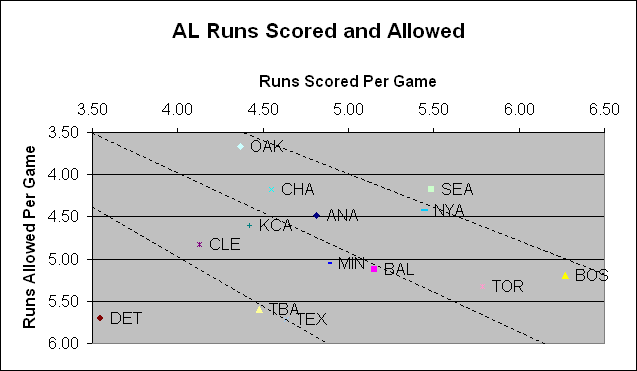
Runs Scored and Allowed

Comments How to Read this Graph
August 2, 2003
Seattle is still the best team in the league, the only team clearly above the .600 isotope, despite their recent slide. Next, you've got three teams just below the .600 isotope: Oakland, with their awesome pitching and fielding; Boston, with their awesome offense, and the well-balanced Yankees. Unfortunately, only two of these teams will be eligible for the playoffs.

Among American League Central teams, Chicago has the best run differential. Only Oakland is clearly better at preventing runs, though the Pale Hose's offense has carried them through their most recent streak. Kansas City's pythagorean difference has made the AL Central race interesting up to now.

TeamWins +/-
ANA-4.45
BAL-2.27
BOS0.31
CHA-0.77
CLE-2.18
DET-3.16
KCA4.64
MIN2.15
NYA2.46
OAK-0.10
SEA -0.79
TBA -1.71
TEX0.99
TOR-4.14


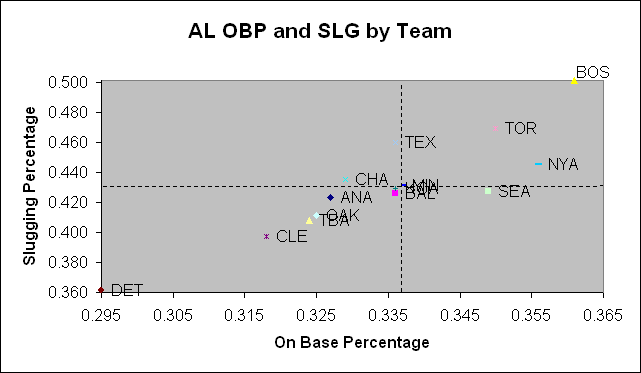
OBP and SLG by Team
TeamRuns +/-
ANA0.08
BAL0.16
BOS-0.07
CHA-0.15
CLE-0.11
DET-0.32
KCA0.30
MIN-0.17
NYA-0.18
OAK0.04
SEA -0.09
TBA -0.02
TEX-0.06
TOR0.23


Comments How to Read this Graph
August 2, 2003
I decided to stretch this graph to fit in Detroit. It makes for a bunched up middle, but at least you can now see the stark difference between the offenses on display in Detroit and Boston. To add insult to injury, Detroit's offense is actually .32 runs/game worse than its combined run elements.

In addition to being the luckiest "pythagorean" team in the League, the Royals are the luckiest "run elements" team, too. Something's got to give. Toronto's positive run differential is also worth noting; their basic offensive elements aren't as close to Boston's as the first graph indicates. By the way, if you combined Texas' slugging with Seattle OBP, you'd have an offense as good as Toronto's.


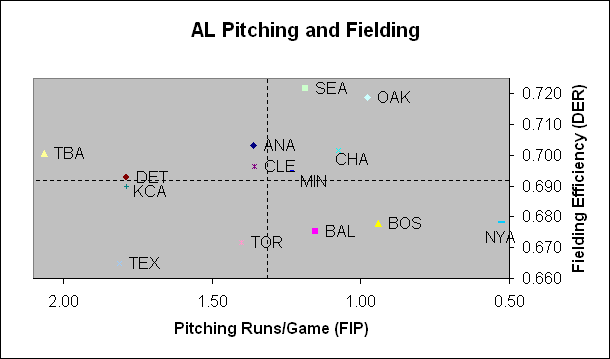
Pitching and Defense

Comments How to Read this Graph
August 2, 2003
The Yankees' pitching is no longer otherworldly good, but it's still the best in the league. And, while their fielding has been better in June and July, it's still below-average. Seattle and Oakland, meanwhile, have superb fielding (even correcting for their ballparks). And so does Tampa Bay (such bad pitching!)

The really interesting team on this chart is the Red Sox. Their pitching is second-best in the league and their fielding, once adjusted for that ballpark on the Pike, is close to average. Yet their runs allowed record is far below average. My assumption is that the bullpen's poor performance in the first half of the year led to an unfortunate bunching of run elements, driving up the actual runs scored. With their recent bullpen acquisitions, the Red Sox just might take over the AL East.

TeamDER +/-
ANA0.002
BAL-0.007
BOS 0.011
CHA-0.004
CLE 0.003
DET -0.001
KCA0.009
MIN0.007
NYA-0.007
OAK-0.006
SEA -0.006
TBA 0.001
TEX0.003
TOR0.002


Major League Baseball Graphs The Dirty Details