Team Graphs on this page: White Sox Indians Tigers Royals Twins
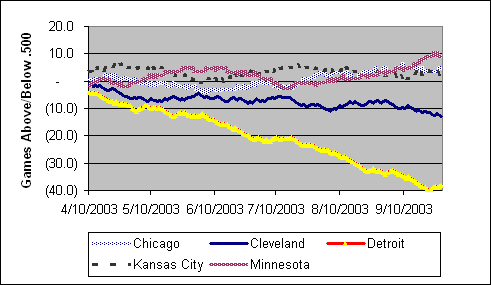
Here's a view of the AL Central standings on a day-by-day basis, starting with the tenth game of the season.
The tables list vital stats by month. FIP stands for "Fielding Independent Pitching" and is based on the following formula: (13*HR+3*BB-2*K)/IP. DER stands for "Defense Efficiency Ratio" and is essentially calculated this way: Non-catcher putouts/# of balls hit fairly (not including HRs). The DER stats on this page are based on limited data; the trend between months per team is more valid than the absolute number.
|
White Sox Comments
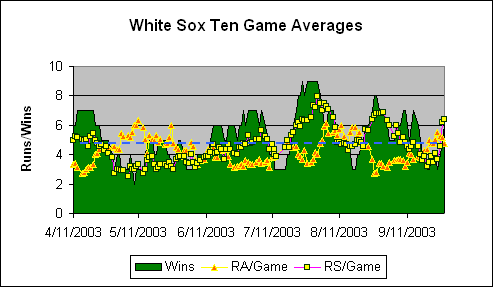
August 31, 2003 The All Star break transformed the White Sox from a sub-.500 team to one of the best teams in the league, featuring outstanding batting and pitching. They hit a mid-August slump at Anaheim and Texas, but otherwise it's been full steam ahead. The real turnaround has come at the plate: Frank Thomas, Magglio Ordonez, Paul Konerko, Carl Everett (nice acquisition), and Joe Crede have all been outstanding in the second half. Only Thomas performed at this level in the first half. Really, the pitching has been good all season long; four of the top twenty pitchers in the league are White Sox and fielding kudos go to Miguel Olivo and Jose Valentin (the AL Gold Glove winner at shortstop, by Win Shares). View individual player Win SharesView individual player stats |
|
Cleveland Indian Comments
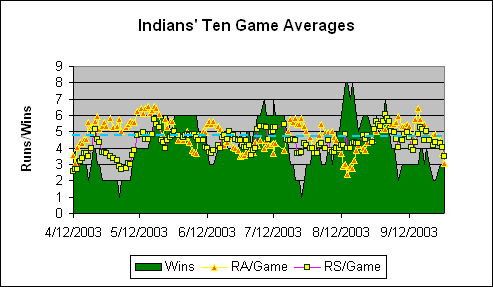
August 24, 2003 This is a team that has improved significantly during the year. It took the Indians 53 games to reach a point at which their runs scored exceeded runs allowed over a ten-game average. By that measure, they had the worst beginning of the season, even worse than the Tigers. They then had a span of 60 games in which they played .500 ball, though they stunk on both offense and defense right after the All-Star break. Now, they are having a very good August. This most recent spurt has come against some decent competition -- Mariners, Angels and Twins -- and their success has been driven by some very good pitching, including good performances from Lee, Traber, Sabathia and the recently departed Anderson . View Individual Player Win SharesView individual player stats |
|
Detroit Tigers Comments
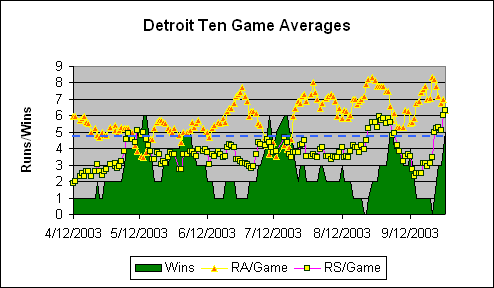
August 24, 2003 Oy. View Individual Player Win SharesView individual player stats |
|
Kansas City Royals Comments
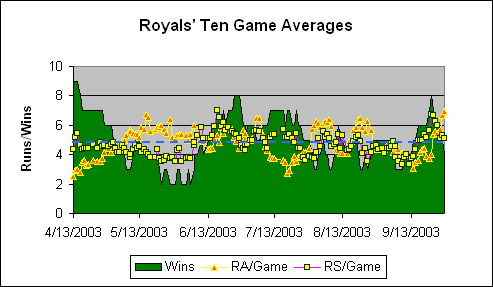
August 31, 2003 The Royals are a wonderful statistical anomaly. They are batting .275 overall, but they lead the league in batting with runners in scoring position, at .306. As a result, they are scoring 1/3 more runs per game than their basic offensive elements would predict. They are also ahead of their won/loss projection (Pythagoras, don't you know) by five games, primarily because they've given up a lot of runs of more than ten in a game (41 altogether). But forget about the obscure statistics. Darrell May? Angel Berroa? Jose Lima? Who knew? The Royals had a great start, and they also had a good run just before the All Star break. However, a lot of this is due to their schedule: the Royals have done a very good job of beating the Tigers, Indians and the first-half version of the White Sox. They are 36-20 in the division and 25-37 against the other AL teams. The Royals will play the Tigers and Indians in September, and they'll manage to miss the Twins, but they won't be able to duck the White Sox (second half version). Should be fun. View Individual Player Win SharesView individual player stats |
|
Minnesota Twins Comments
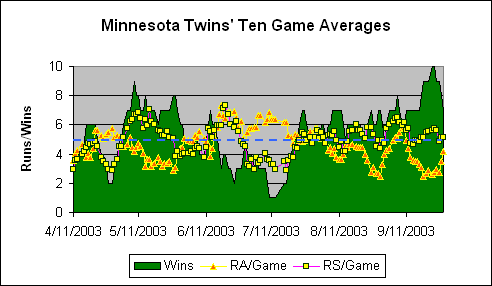
August 31, 2003 The Twins were awesome in May, horrible in early July but, most importantly, above average in August. For the month of August, they've managed to stay at 6/10 games won on a steady pace. They haven't experienced a dramatic turnaround a la the White Sox, but they've had just as good a record since the All Star break. They've been doing it with pitching and fielding. The starting rotation, so brutal at times in the first half, has been very, very good. Johan Santana has the league's second-best second-half ERA (2.39; leader is Tim Hudson at 1.74), and Lohse and Rogers have been solid. The Twins also have one of the best bullpens in the league. View Individual Player Win SharesView individual player stats |