Major League Baseball Graphs | The Dirty Details |
American League East |
AL as of May 4th |
American League Central |
|
American League West |
|
|
Team | Runs +/- |
ANA | 0.24 |
BAL | 0.43 |
BOS | 0.41 |
CHA | -0.30 |
CLE | -0.22 |
DET | 0.13 |
KCA | -0.61 |
MIN | -0.02 |
NYA | -0.07 |
OAK | 0.02 |
SEA | 0.43 |
TBA | 0.08 |
TEX | -0.68 |
TOR | 0.33 |
Comments | How to Read this Graph |
May 25, 2003
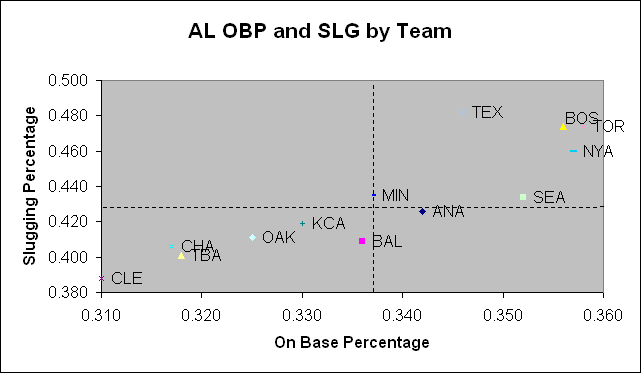
As mentioned, Boston and Toronto are the best offensive teams in the league, but the Yankees also deserve to be right with them. The first two teams are making more of their "run elements." Seattle's OBP is very good, but their average slugging holds back their offense. Texas, on the other hand, has the best slugging in the league. But their OBP and, more importantly, their unlucky distribution of offensive elements is holding back their offense. Look for Texas' offense to improve, and Seattle's and Boston's to fall back a bit. Detroit's incredibly anemic offense is literally "off the charts." They're somewhere down near your "Start" button. |
Team | DER +/- |
ANA | 0.002 |
BAL | -0.007 |
BOS | 0.011 |
CHA | -0.004 |
CLE | 0.003 |
DET | -0.001 |
KCA | 0.009 |
MIN | 0.007 |
NYA | -0.007 |
OAK | -0.006 |
SEA | -0.006 |
TBA | 0.001 |
TEX | 0.003 |
TOR | 0.002 |
Comments | How to Read this Graph |
May 25, 2003
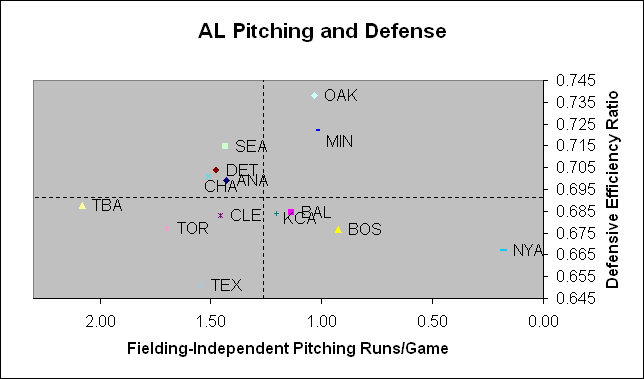
Take a look at Oakland. Their pitching is among the best in the league, but it's their fielding that really makes them stand out. Maybe that pick up of Chris Singleton really was another act of Beane genius. Whatever. Conversely, the Yankees own easily the best pitching performance in the league, but their fielding is the second-worst (the Yankees have a flaw!). Now look at Texas: their pitching is only slightly worse than average, on a par with a host of other teams such as the Angels and Mariners. But it's their fielding, worst in the league, that sinks them. |
Major League Baseball Graphs | The Dirty Details |