American League East Team-by-Team
Review the American League Graphs
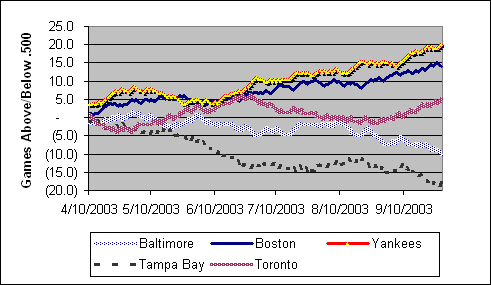
Here's a view of the AL East standings on a day-by-day basis, starting with the tenth game of the season.
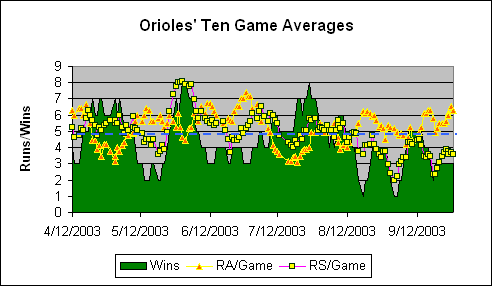
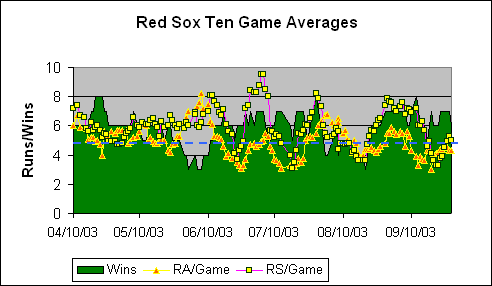
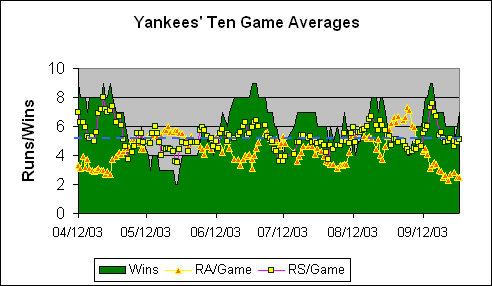
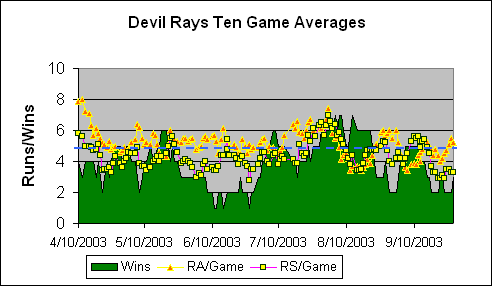
Following are graphs of the ten-game averages for each team. The green area represents the number of games each team has won of its last ten played. The two lines are 10-game moving averages of runs scored and allowed per game over the same time period, adjusted for park factors. The fixed line represents the league average number of runs scored per game.
The tables list vital stats by month. FIP stands for "Fielding Independent Pitching" and is based on the following formula: (13*HR+3*BB-2*K)/IP. DER stands for "Defense Efficiency Ratio" and is essentially calculated this way: Non-catcher putouts/# of balls hit fairly (not including HRs). The DER stats on this page are based on limited data; the trend between months per team is more valid than the absolute number.
|
Baltimore Orioles Comments
August 31, 2003 In the first third of the year, the Orioles had some middling success by playing a string of games against the Tigers and Devil Rays. In July, they had a nice streak against some good teams, including the Braves, Blue Jays, Phillies and Yankees. This was their best streak of the year, including some very good pitching. Jason Johnson, Pat Hentgen and the since-departed Sidney Ponson all pitched very well in July. Unfortunately, the O's played some of their tough neighbors in the AL East in August, and the results haven't been good. Although Johnson and Hentgen have continued to pitch well, they have come apart in nearly every aspect of the game. Their August offense was just terrible (about equal to the Tigers in May) and their first-half star, Melvin Mora, has barely played since the All-Star break. It's hard to statistically judge the Orioles' fielding. Their park-adjusted DER is low and they have the second-least fielding Win Shares as a team. But their Zone Rating is league-average, and at least Tony Batista and Brian Roberts appear to be good fielders. Jay Gibbons (the team leader in Win Shares) appears to have the range of a rock in right. View Individual Player Win SharesView individual player stats |
|
Boston Red Sox Comments August 31, 2003 I haven't seen it mentioned anywhere, but the Red Sox' pitching has been terrible with runners in scoring position. Overall, batters are hitting .267 against Sox pitchers, but they're batting .296 with runners on, and .289 with runners in scoring position. Much of this was due to their poor bullpen in the first half of the year and they've improved their performance with RISP the second half of the year. The Red Sox would be the best team in the league without this. In fact, the Red Sox's pitching has been very, very good since May. The Red Sox's fielding, however, continues to be mediocre. As an example, check out the low proportion of win shares attributed to Red Sox' fielding. Or the American League charts. Of course, the Red Sox have the best offense in the league. View Individual Player Win SharesView individual player stats |
|
New York Yankees Comments August 31, 2003 The Yankees had a simply phenomenal start; they were eight games over .500 in late April. Their start was so phenomenal, that it's easy to overlook the fact that they've had the best record in the division since then. The Yankees are just a very good team. Despite the struggles of Jeff Weaver and, most recently, David Wells, the Yanks' FIP is still best in the league. Among everyday players, Posada is the league's best catcher by far, and only great seasons by Delgado and Boone are keeping Giambi and Soriano from the head of their class. The Yankees could upgrade their outfield (and their defense) but at least Bernie Williams is hitting his stride. And Nick Johnson is a star when healthy. View Individual Player Win SharesView individual player stats |
|
Tampa Bay Devil Rays Comments August 31, 2003 Tampa Bay "turned it around" in the beginning of July, thanks to their turnaround in one-run games. See, they actually won four out of five one-run games in a row, after not winning one since May 18th. Overall, they are now 21-23 in one-run games. At the end of July, they started their best offensive surge of the season. In particular, Travis Lee was on a real tear. Most recently, Aubrey Huff (their Win Shares leader) has been hitting up a storm, and Rob Bell's last four starts have all been quality starts They're actually a pretty good fielding team, but you wouldn't know it, because their pitching is the worst in the league. Their fielding is receiving the highest allocation of defensive Win Shares (almost 39%) of all major league teams. View Individual Player Win SharesView individual player stats |

|
Toronto Blue Jays Comments August 31, 2003 Over the first half of the year, the Blue Jays' offense was as strong as Boston's. Since July 1st, however, they've been below-average in runs scored. And the pitching/fielding haven't helped. The Blue Jays are one of the worse fielding teams in the league, according to Win Shares and park-adjusted DER. However, the Jays' team Zone Rating is around league average. This actually may be a case in which the pitching is partly to blame for the poor defensive standing. I estimate that the Blue Jays have the highest percent of batted balls falling into "unfieldable zones," putting their fielders at a disadvantage. View Individual Player Win Shares
|
