Major League Baseball Graphs The Dirty Details

2003 American League

Also view these related graphs:
American League East
AL as of May 4th
American League Central
AL as of May 25th
American League West

Runs Scored and Allowed

Comments How to Read this Graph
July 1, 2003
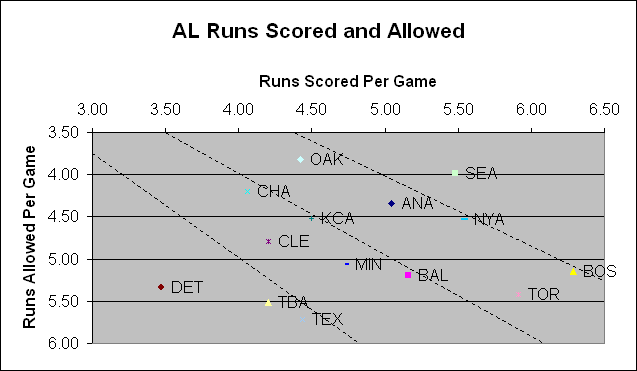
Over the past month, Seattle, thanks to its outstanding defense, has climbed far above the .600 level and become the best team in the league. The Yankees have also played well (thank you, Mets). The next group of teams, Oakland, Boston and Toronto, maybe Anaheim, appear to be contenders for the wild card. By the way, Oakland used to be the clear league leader in least runs allowed, but Seattle has largely closed the gap. The AL Central could be a three-team race among .500 ballclubs; maybe even a four-team race sometime during the year, as Cleveland also had a strong month.

Boston's offense is so strong, I had to tweak the graph to fit them in. Meanwhile, poor Tampa Bay had a miserable Pythagorean month. Most of those negative wins occurred in June.

TeamWins +/-
ANA-3.31
BAL-4.23
BOS0.51
CHA-0.50
CLE-0.80
DET-3.43
KCA4.47
MIN0.82
NYA2.04
OAK1.34
SEA -0.89
TBA -2.86
TEX1.39
TOR-1.82


OBP and SLG by Team
TeamRuns +/-
ANA0.16
BAL0.17
BOS-0.01
CHA-0.19
CLE-0.11
DET-0.27
KCA0.33
MIN-0.30
NYA-0.23
OAK0.10
SEA -0.07
TBA -0.10
TEX-0.16
TOR0.27


Comments How to Read this Graph
July 1, 2003
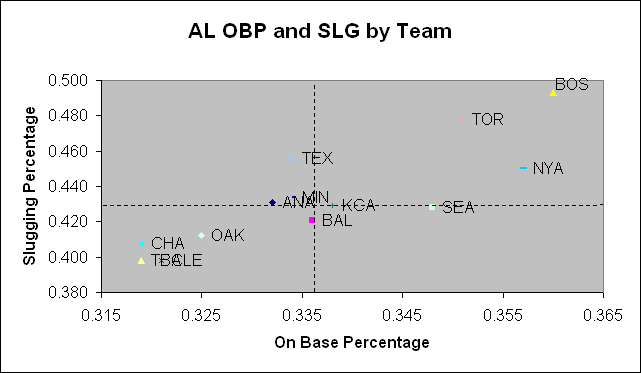
Like the National League, there are lots of average offensive teams in this league. The real story lies in the outliers: Boston (whoa!), Toronto and the Yankees on one end, and the Sox, Indians and Tampa Bay on the other. The real outlier, the Tigers, aren't even on this chart. Check out your start button to find them.

Texas has seen its offense collapse a lot in the past month. See their team chart for more details. Seattle continues to follow the Billy Beane philosophy of offense by OBP, but their slugging has declined in the past month.


Pitching and Defense

Comments How to Read this Graph
July 1, 2003
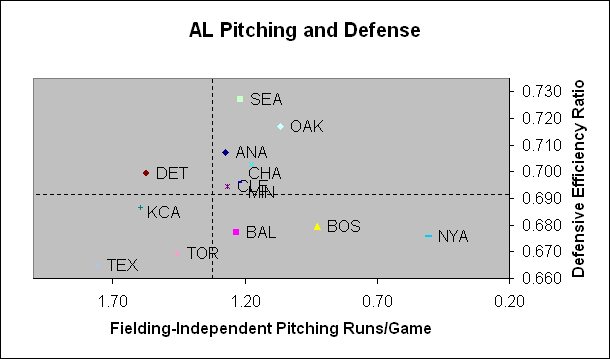
Seattle is about two things: OBP (see above graph) and fielding. Yes, their fielding is helped by that park, but still...

Meanwhile, the Yankees' pitching is so good they skew the chart. Another interesting team is Tampa Bay, which apparently has been fielding very well. Unfortunately, they have the worst pitching in the league.

TeamDER +/-
ANA0.002
BAL-0.007
BOS 0.011
CHA-0.004
CLE 0.003
DET -0.001
KCA0.009
MIN0.007
NYA-0.007
OAK-0.006
SEA -0.006
TBA 0.001
TEX0.003
TOR0.002


Major League Baseball Graphs The Dirty Details