American League West Team-by-Team
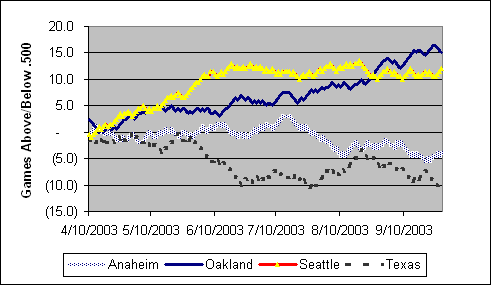
Here's a view of the AL West standings on a day-by-day basis, starting with the tenth game of the season.
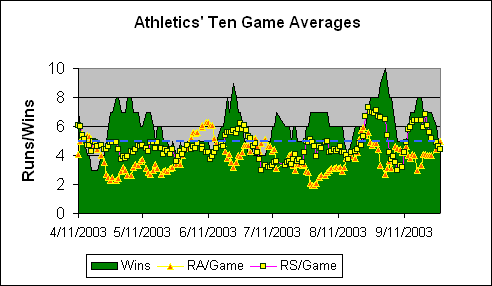
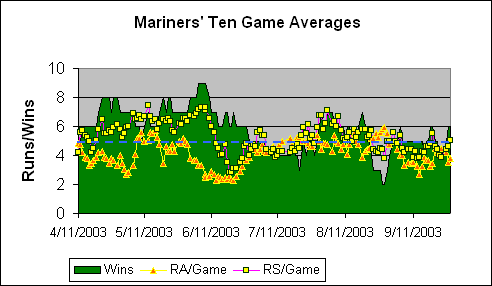
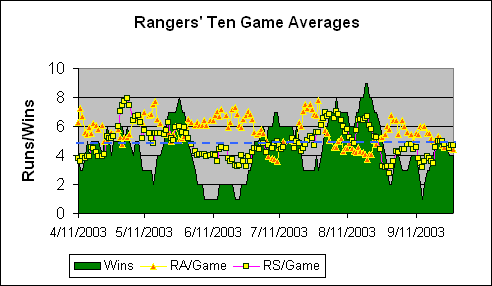
Following are graphs of the ten-game averages for each team. The green area represents the number of games each team has won of its last ten played. The two lines are 10-game moving averages of runs scored and allowed per game over the same time period, adjusted for park factors. The fixed line represents the league average number of runs scored per game.
The tables list vital stats by month. FIP stands for "Fielding Independent Pitching" and is based on the following formula: (13*HR+3*BB-2*K)/IP. DER stands for "Defense Efficiency Ratio" and is essentially calculated this way: Non-catcher putouts/# of balls hit fairly (not including HRs). The DER stats on this page are based on limited data; the trend between months per team is more valid than the absolute number.

|
Anaheim Angels Comments
August 31, 2003 Starting in mid-July, the World Champions began to slowly sink in the West. Their pitching and defense didn't support them in the second half of July. And the offense really stunk up the joint. During August, the offense has made a steady climb back to average. Actually, the Angels had a great offensive spurt in early June against some National League teams. These guys must be playing in the wrong league. A lot has been written comparing this team to last year's champions, and here's one more perspective: Last year, they led the league in getting runners into scoring position (1,596 at bats with RISP). This year, they are 15th (at 1,174 through August). The one player living up to his 2002 standard is Garrett Anderson (23 Win Shares so far this year, vs. 24 all of last year). View Individual Player Win SharesView individual player stats |

|
Oakland Athletics Comments
August 24, 2003 Thanks to the last three games, the A's offense is having its best surge of the year. Up to those three games against the Blue Jays, however, their offense had been running at their average rate, so let's see what happens from here on. As stated elsewhere, the A's fielding is a real statistical enigma. It seems likely that their fielding is about league average, and their pitching staff and home park deserve most of the credit for their above-average DER. View Individual Player Win SharesView individual player stats |

|
Seattle Mariners Comments
August 31, 2003 Through the end of June, the Mariners were the class of the league, by far (linked graph is as of July 1st). Their offense and defense (particularly their fielding and OBP) were both outstanding. Since July 1st, however, they have been a .500 team. The pitching -- particularly the starting pitching -- had its worst month in August. And the team slugging percentage, never really a strength, also had its worst month in August. The Mariners have the best defense in the league, by far (even when adjusting for their home ballpark, which is fielder-friendly). Cameron, Suzuki and Winn are among the top nine defensive outfielders in the league, according to Win Shares. View Individual Player Win SharesView individual player stats |

|
Texas Rangers Comments
August 15, 2003 The Rangers have had a good first half of August; the hitting and pitching/fielding have all had just about their best stretches of the year. On offense, Blalock and the nearly traded Palmeiro have been hot, though the hottest of all has been ARod. In fact, if ARod keeps this up, he may wind up challenging Delgado and Boone for the league lead in Win Shares. On defense, Thomson and Dickey are pitching well, but the team DER has also experienced a big uptick in August. I guess this was inevitable for the worst fielding team in the league. View Individual Player Win SharesView individual player stats |
