Win Share Team Graphs
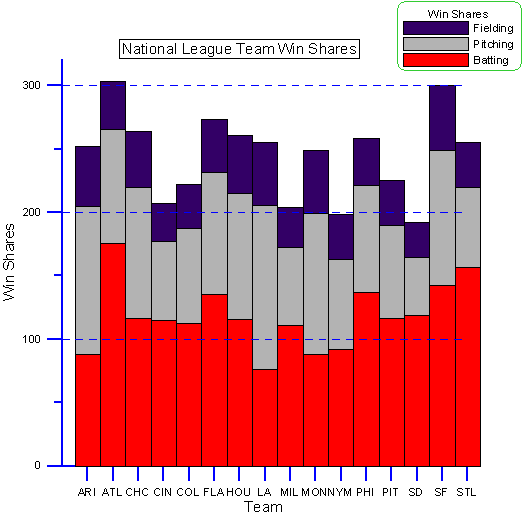
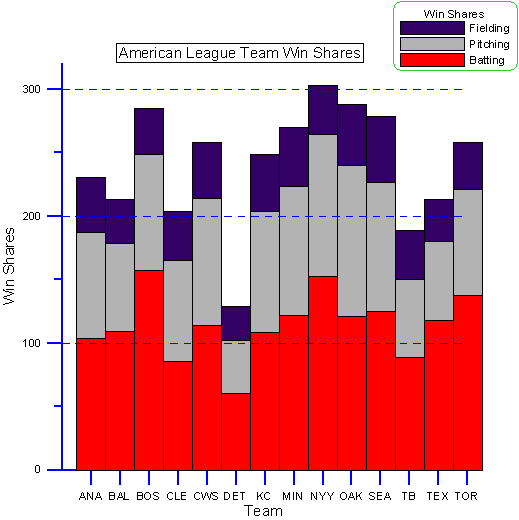
Here are a couple of graphs which break out the strength of each team, according to Win Shares. The Win Shares system allocates the "credit" for each team's wins to batting, pitching and fielding using a variety of statistics. These graphs show the total number of each team's wins that are credited to each factor.
These graphs are designed to allow you to quickly see the relative strength of each team. The data for these graphs comes from the Team Graphs.
Here are the National League teams. Check out the Braves' batting Win Shares and the Dodgers' pitching Win Shares.

Here are the American League teams. The Red Sox actually have less batting Win Shares than the Braves. Of course, several teams have more batting Win Shares than the Tigers have total Win Shares.
